Sunday, December 11, 2016

HEC-RAS Tutorial Course

Aim


  • To give an introductory know how about using HEC-RAS 5.0.3.


Target Audience


  • Engineers (Civil, Environmental, Agricultural and Others) with some background in Hydraulics and Water Resources. It is assumed that student does not have a prior knowledge of HEC RAS.


Requirement


  • Must have taken undergraduate level Hydraulics and Hydrology Courses


Material


Course Outline

Exercise-1 - Working to find optimized cross-section for a constricted canal
Exercise-2 - [still in making ...]

Starting HEC-RAS

1. Open HEC-RAS


2. Set units to SI units
Main Window -->Options--> Unit system (…)
On the New small window click on “System International (Metric System)


3. Click on File --> New Project

 4. Enter Project Information
Enter Short Project Title and Project Filename (extension is added automatically)

Short Project Title:  Irrigation Channel
Project Filename: IrrigationChannel (extension is added automatically)
Press OK on the “New Project” Window

 5. Project Description
Add Project Description: “Irrigation Channel – with constriction” on the main window.


Problem Statement                                                                 Create Geometric Data File

Geometric Data File

1. On the main window of HEC-RAS, Click on Edit-->Geometric Data


2. On ‘Geometric Data’ Window, Click on ‘River Reach’

After the click, your mouse cursor will become a pencil.


3. Click on any place on the white area of ‘Geometric Data’ Window. This is a rough sketch of your river reach you are about to model. In our case, this is an 800 m long channel with straight length. You can just double click somewhere on the screen to show the end of the reach. A line will be shown similar to the figure below.

4. Write the river and the reach names
River: New Canal
Reach: Constricted
And Click ‘Ok’


Now you have to edit river cross section data. Click on Cross Section tab  , It is 2nd from the top on the left side of the window.

Before you have to do some rough work on paper or on AutoCAD to help you during this activity
This rough work includes following steps.


 i. Draw a rough plan view on paper and mark all important locations of this channel. Important means
           a. Start and end points, and locations where cross –section changes, as shown in the figure below.

           b. Make a longitudinal profile (see the figure below)
           c. Make a datum line (any distance below the lowest point of the channel can be chosen). Here, in this exercise we have chosen datum line below 9m from the lowest point.
           d. Use this datum line, channel slope, and cross section shape to calculate the coordinates of the cross section. (Please note that cross-sections are entered as coordinates of cross section in way that the left most point of the cross section is 0 in the horizontal plan)
 ii. See which points are important as far as channel geometry is concerned
          a. HEC-RAS requires cross section details at start and end of the reach
          b. It also requires points where cross section geometry changes
          c. You should notice that there are four river stations where the channel needs to be entered in the cross section editor of HEC-RAS.
          d. Since downstream RS (river station) no. is lowest in HEC-RAS. Name these 4 RSs from 1.0 to 4.0 from downstream RS to most upstream RS.

iii. Take any arbitrary benchmark (sea level) and assume that channel invert (lowest point of the channel) of the most downstream cross section is at 2.4m above it. Now you already have the slope, so you need to calculate the channel invert at RS. 4.0 (most upstream RS). HEC-RAS will calculate the channel invert at RS. 2.0 and 3.0 during the process of interpolation.

iv. Now with the help of this rough work you should be able to draw the cross sections of RS 1.0 and RS 4.0 as it is required in HEC-RAS. Since the cross section geometry is rectangular. You will require 4 points to define a cross section.


5. On Geometric Data window on ‘Cross Section’ icon.
i. On Cross section data window click on Options-->Add a new cross section
ii. Name RS as 1.0 on prompted window.

iii. Enter Station and Elevation values as shown below and click on ‘Apply Data
Click on ‘Apply Data’
Enter Manning values which is 0.012,
LOB is 0 and ROB is 5

iv. Repeat step ‘a’, ‘b’ and ’c’ for RS 4.0, that is
On Cross section data window click on Options-->Add a new cross section Name RS as 4.0 on prompted window.
Enter Station and Elevation values
LOB is 7 and ROB is 15
Downstream reach length is 800m


v. Close cross section editor. Now the main geometric window should show RS 4.0 at upstream and RS 1.0 at downstream as shown in the figure.


6. Now you have to make use of interpolation process to introduce cross section at 200m from RS4.0
On ‘Geometric Data’ Window Click on Tools-->XS Interpolation -->Between 2 XS’s


7. On new window select option ‘Set Location (m)’, and enter 200 in distance


8. Click on ‘Interpolate New XS’s’
This will make a new interpolated XS at 200 m with name 3.2500*.
See the 3D view of the channel (XYZ Plot  HEC-RAS-->View-->X-Y-Z Prospective Plot) you will notice that this is not the desired shape of channel cross section. Because Channel has to be prismatic between RS 4.0 and RS 3.25*
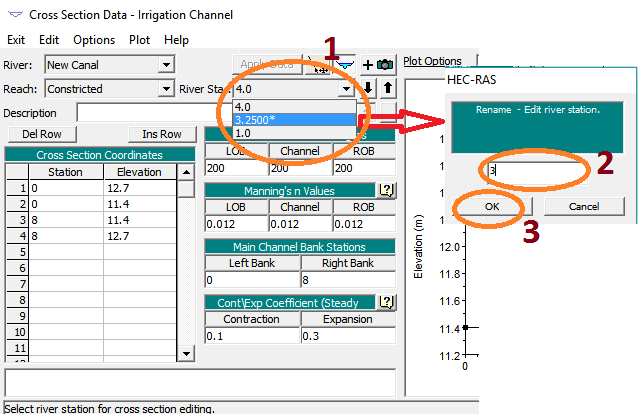
9. Again go to the Cross section editor and
a. Open RS 3.2500* and Change name of cross section from 3.2500* to 3.0. On ‘cross section data’ window click on Option-->Rename River Station

b. Make station values same as these are in RS 4.0, Do not change elevation values. Also, change LOB and ROB of interpolated cross section. Click “Apply Data” and close the window.
c. Close Cross section editor


10. Now you have to again interpolate to place a cross section at point D. which is 20 m ahead of RS 3.0.
Repeat steps from 11 to step 14 to create RS 2.0. Therefore now enter distance as 20 m from RS 3.0
On ‘Geometric Data’ Window Click on Tools--> XS Interpolation --> Between 2 XS’s
Select upper river station as 3.0
On new window select option ‘Set Location (m)’, and enter 20 in distance


11. Again go to the Cross section editor and
a. Open RS 2.9333* and make station values same as these are in RS 1.0, Do not change elevation values. Also change LOB and ROB of interpolated cross section (same as in RS 1.0)
b. Rename 2.9333* to 2.0


 c. Change the RS 2.0 “Station values” as these are in RS 1.0. Change LOB and ROB. Apply data and close the "Cross Section Date" window.

Since we are interested to know water surface profile of this channel, therefore, we are interested in having sufficient number of River Stations. Thus, we will now interpolate cross sections at every 6m in the whole reach
12. On ‘Geometric Data’ Window Click on Tools-->XS Interpolation -->Within a reach

a. Set “maximum distance between XS’s” as 6
b. Click on “Interpolate XS’s” and close the window


c. Geometric Data window will now look something like this


13. On ‘Geometric Data’ window click on File -->Save Geometry Data. If will have prompted, give a proper file name for geometric data.


a.       Close Geometric Data Window


Starting HEC-RAS                                                                                   Steady Flow Data File


Steady Flow Data

1. On main ‘HEC-RAS’ window click on Edit -->Steady Flow Data


2. On ‘Steady Flow Data’ window, enter the flow value, which is 13 m3/s.

3. On ‘Steady Flow Data’ window, click on ‘Reach Boundary Conditions’
4. On ‘Steady Flow Boundary Conditions’ window, first Click on blank cell below Downstream column and then click on ‘Normal Depth.
5. On new Window enter the value of slope given in Exercise statement. The value of slope is 0.005. and Press ‘OK’.
6. On ‘Steady Flow Boundary Conditions’ window, Press ‘OK’

 7. On ‘Steady Flow Data’ window click on File-->Save Flow Data

 a. Give and appropriate title and Press OK.


8. Close ‘Steady Flow Data’ Window

Geometric Data File                                                                          Steady Flow Simulation

Steady Flow Simulation

1. On main ‘HEC-RAS’ window click on Run-->Steady Flow Analysis
2. On ‘Steady Flow Analysis’ window click on ‘Compute’.


3. A new window will open showing the status of calculations. If everything went fine so far, this window shows “Finished Steady Flow Simulation”

4. On successful finish of computation click close on

5. Close ‘Steady Flow Analysis’ window

Steady Flow Data                                                                       Check Water Surface Profile

Check Water Surface Profile

1. On main ‘HEC-RAS’ window click on View-->General Profile Plot …


a. A ‘General Profile Plot’ Window will open showing a plot of velocity (or some other variable) along the length of canal channel. Since we are interested to see Hydraulic depth (depth of water surface) to check that designed depth is sufficient or not, therefore, we will change the variable. On ‘General Profile Plot’ Window, click on Options-->Plot Variables
b. A new small window “Y Axis Variable” will open. Click on “Clear All” to delete existing variables. Now scroll down the available variables to see the “Hydr Depth”.


c. Now click on “Hydr Depth” in the available variables. Click on the arrow button beside the “Available Variables” to include “Hdyr Depth” in the list of selected variables. Click “OK”


d. Now you can see the water depth along the length of the channel. If the plot does not look as shown in the figure below, you can change the line color and thickness by Options -->Lines and Symbols …


e. Notice that the maximum water depth is a little above 1.2m but below 1.3m which means that water depth is below the channel’s height.

f. You can also look the result in tabular form. On HEC-RAS' main window go to View-->Profile Summary Table....


g. You can now notice that “Hydraulic depth” is not included in the table. However, you can add this and remove unnecessary information by Profile Output Table Window -->Options-->Define Table …

h. In the new window “Create a Table Heading”, click on an empty column heading e.g. on column heading ‘11’. Find “Hydr Depth” variable in the list of available variables and double click on it. Click ok to close the “Create a Table heading Window”.


i. Now you can see that our desired variable has appeared in the main table. Notice that the maximum water depth is at RS 3 and is 1.22m.

j. You can also copy this data and paste it in Microsoft Excel for further necessary calculations or for making other graphs. Click on top left cell of the table and then go to File -->Copy to Clipboard (Data and Headings).

k. Now you can paste this data in Microsoft Excel or any other place you want.


l. Since you have added a variable “Hydr Depth” by yourself, as this variable was not already there, therefore you can save this table so that next time when you need to see similar table, you can see it easily. So save the table by (on HEC-RAS main window) Options --> Save Table . Give it a special name like “Tutorial Table”. Click OK to close it.


m. Close ‘Profile Output Table’ window.


Steady Flow Simulation                                                                                Generate Report

Generate Report

1. On main HEC-RAS window, click on File-->Generate Report
2. On ‘Report Generator’ window
a. Double Click on ‘Tutorial Table’ from the list of Available Summary Tables
b. Click on ‘Generate Report’
c. Click on ‘View Report’


3. Generated report will open in a new window. The initial part of the report will consist of Input values. At the bottom of this report, you can see the Output table “Tutorial Table”


Check Water Surface Profile                                                                              Next Task